The Linear Trend filter calculates a straight line best-fit for your DataSeries. This can then be plotted as a line series on the chart.
Applying a Linear Trendline to Chart Data
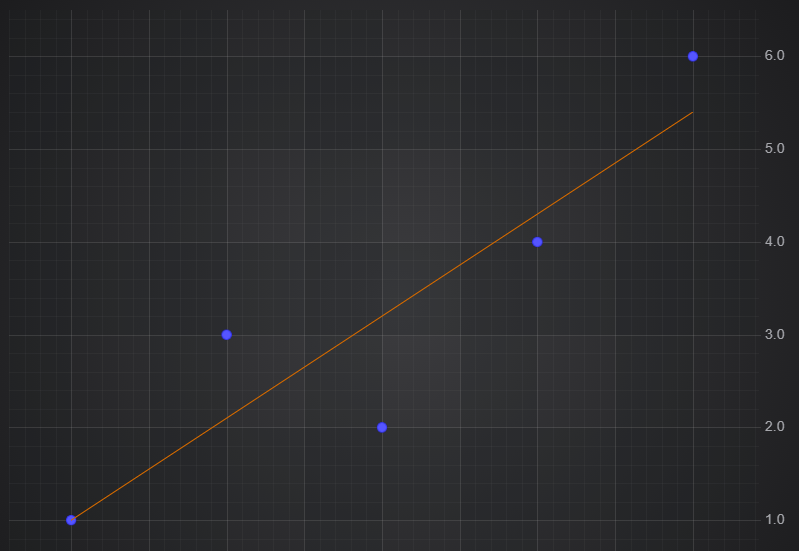
To calculate a Linear Trendline use the following code.
This results in the following output:
Accessing Trendline Properties
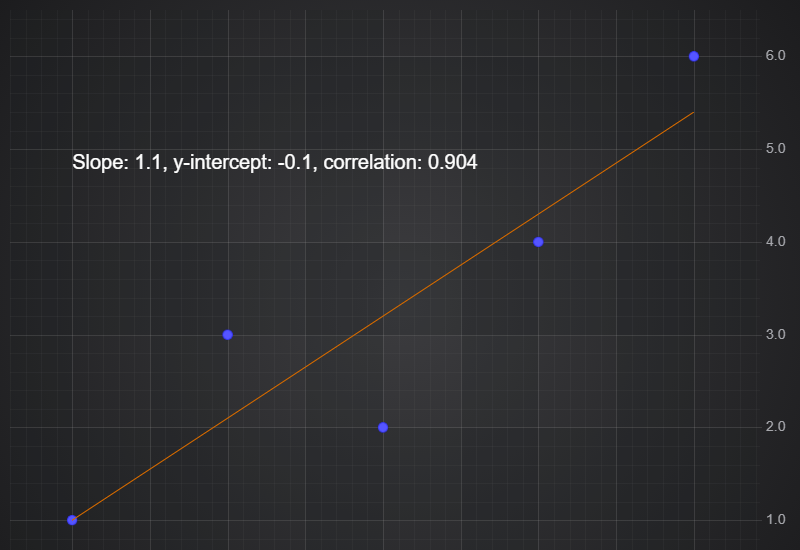
The XyLinearTrendFilter has properties for slope, intercept and correlation which you can use to access the parameters of the trend line.
For example you could display them using an annotation like this:
Specifying the Input Field
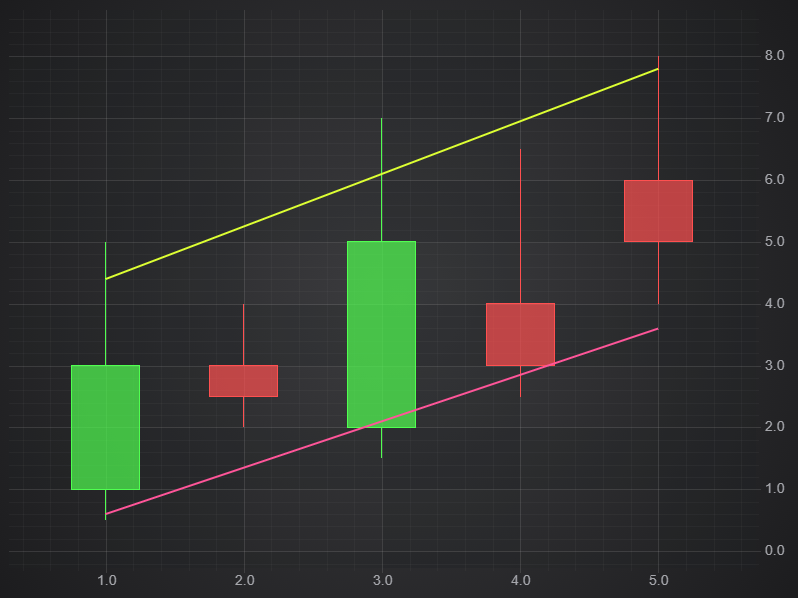
The XyLinearTrendFilter produces an XyDataSeries, but it can accept any series type as input. The options includes a field property of type EDataSeriesField, which determines which field on the original series will be the input.
This example takes a OHLC Series as input and plots separate trendlines for the High and Low values: